
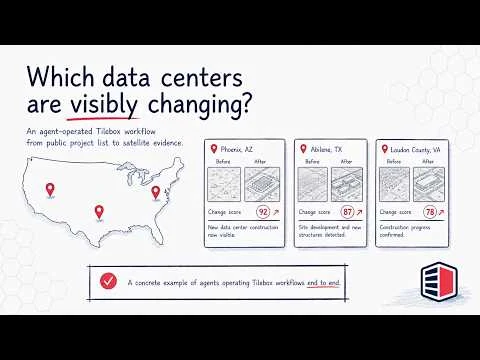
Starting from a prompt, an AI agent writes a workflow, deploys it to cloud compute, and processes satellite imagery to track US data center growth. The first results include false positives, so we inspect the logs and outputs, debug the workflow, and improve it.
The result is a browsable tracker backed by reproducible satellite-data processing.
Explore agentic development with Tilebox.
Transcript
The data center tracker
0:01 This is a tracker for data center growth in the US. It looks at known data center sites, compares satellite images over time, and shows where construction actually took place. You can open a site, compare before and after images, and check why it was flagged.
0:22 But the point of the demo isn’t really the website itself, but how we built it. We built the workflow behind it using an agent running on Tilebox. So let’s get into it.
From prompt to workflow
0:36 Satellite data can answer really practical questions, like where a new infrastructure is being built. But getting from that question to something people can use is usually the hard part. You need data, code, compute, models, and a lot of glue to hold it all together. That’s what we want the framework and agents to handle.
0:54 We’re not asking the agent to write an answer. We’re asking it to build the thing that finds the answer. You describe what you want, and then the agent writes the workflow, runs it on real data, and improves it when it gets things wrong.
1:08 Here’s the prompt that we gave it. Find known data center sites, compare them over time, flag the strongest visible changes, and produce outputs we can use on a website. So the output isn’t a report in this case, it’s the raw material for the demo site.
1:25 The agent then turns that prompt into a set of steps: load the sites, draw a search area around each one, find before and after imagery, measure what changed, and then write out the results. Now the question is something that we can actually run.
1:42 On Tilebox, that plan then is turned into workflow code. So that’s code we can read, we can change it, we can run it again, deploy it at scale. And the way it looks like is the work is split into tasks. One task loads the sites, then each location is processed in parallel. It finds imagery, scores the change, writes the output, and then at the end, everything gets combined. That means we can test the workflow on a few sites quickly, and only then run it for the whole dataset.
Deployment and execution
2:19 And this is not running inside a chat window. So the agent deploys the workflow to its compute cluster. So we don’t rewrite it just because we want to scale it up. Tilebox handles that, the execution around the code.
2:35 As it runs, we can watch the job in Tilebox. We can see the progress, the tasks, the logs, the outputs. The agent can see all of that too. So if something breaks, or if the results look wrong, it can inspect the actual run.
Inspecting and improving the results
2:55 Here’s the first test run. Some of the top results are real construction, but some are not. There are things like vegetation changes. That’s okay, because now we can see the mistakes, and the agent can use those mistakes to improve the workflow.
3:11 That’s exactly why we need workflows to be inspectable. So we can see what went wrong. And then humans and agents can use that data to improve the analysis. So we ask it to fix that.
3:26 It updates the workflow, deploys it again, and runs another test. That takes seconds. This time, we add a visual change score. So instead of only looking at satellite bands, we also compare how the images actually look. That helps separate real construction from noise.
3:44 Now the workflow is good enough to run across the whole list. So we submit the full job. Same workflow, just more sites.
The finished tracker
3:52 And this is the final product, a tracker for data center construction. You can sort by the biggest changes, open a site, and compare the images. You can check the scores and see the overall trend.
4:19 The nice part is that nothing’s hidden. The prompt is actually visible here on the website. We have the whole session recorded. The workflow code is available on GitHub. And the logs and outputs can be recreated. So we can inspect it, change it, and keep iterating.
4:42 And data centers really are just one example. You can use the same pattern for ports, farms, mines, disasters, or any place where you can care about change over time. Tilebox gives the agent a real place to work. It gives it the data, the compute, the deployment, and the feedback from each run.
Try it yourself
5:04 We’re open sourcing the code and the prompts behind this demo for your inspiration. You can clone the repo, run a small version locally, or deploy it to autoscaling clusters in the cloud. You can change the idea or use different sites, different imagery, or algorithms.
5:21 To do that, you can use Tilebox Labs, our free tier, and point your agent at docs.tilebox.com to install skills and the CLI. And if you’re not ready to build yet, join the product updates list on Tilebox.com or come talk to us on Discord.