

Create a Sentinel-1 radar image
Query a Sentinel-1 GRD scene and render a monochrome image from its public SAR measurement COG.
Tilebox indexes global Sentinel-1 Ground Range Detected (GRD) scenes and their public AWS assets in the open_data.aws_earth.sentinel1 dataset. In this guide, you query a scene over Venice, read its VV polarization measurement, and create a north-up monochrome radar image.
Prerequisites
- You have a Tilebox API key.
- You have Python 3.11 or newer.
uv add tilebox shapely numpy pillow rasterioSelect a Sentinel-1 scene
Define an area around Venice, then query a dual-polarization Sentinel-1C scene from October 4, 2025:
from shapely import box
from tilebox.datasets import Client

# west, south, east, north
area = box(12.3, 45.385, 12.49, 45.466)  # Venice

collection = Client().dataset("open_data.aws_earth.sentinel1").collection("GRD")
scenes = collection.query(
    temporal_extent=("2025-10-04", "2025-10-05"),
    spatial_extent=area,
)

datapoint = scenes.isel(time=0)
print(datapoint.stac_id.item())
Resolve the VV measurement
Each datapoint provides measurement COGs for its available polarizations, alongside product, calibration, noise, manifest, and preview assets. Select the VV measurement and resolve its public HTTPS location:
from tilebox.datasets.assets import AssetCollection
from tilebox.storage.aio import AssetAccessPolicy, Client as StorageClient

assets = AssetCollection.from_datapoint(datapoint)
vv = assets["vv"]

storage = StorageClient(
    policy=AssetAccessPolicy(preferred_schemes=("https",)),
)
resolved = storage.resolve(vv)
No AWS credentials or requester-pays configuration is required for this asset.
Read a north-up image window
Sentinel-1 GRD measurement COGs store geolocation as ground control points. Use a WarpedVRT to apply that geolocation, project the image, and read a bounded north-up window without downloading the complete scene:
import numpy as np
import rasterio
from rasterio.enums import Resampling
from rasterio.vrt import WarpedVRT
from rasterio.warp import transform_bounds
from rasterio.windows import from_bounds

with rasterio.open(resolved.href) as source:
    with WarpedVRT(source, crs="EPSG:3857") as geotiff:
        projected_bounds = transform_bounds(
            "EPSG:4326",
            geotiff.crs,
            *area.bounds,
        )
        window = from_bounds(*projected_bounds, transform=geotiff.transform)
        vv_pixels = geotiff.read(
            1,
            window=window,
            out_shape=(675, 1200),
            resampling=Resampling.bilinear,
        ).astype(np.float32)
Render the radar image
Stretch the central 96% of valid pixel values across a gray display range, then save the result:
from PIL import Image

valid = vv_pixels[vv_pixels > 0]
low, high = np.percentile(valid, (2, 98))
grayscale = np.clip((vv_pixels - low) / (high - low), 0, 1)

image = Image.fromarray((grayscale * 255).astype(np.uint8), mode="L")
image.save("sentinel1-venice.png")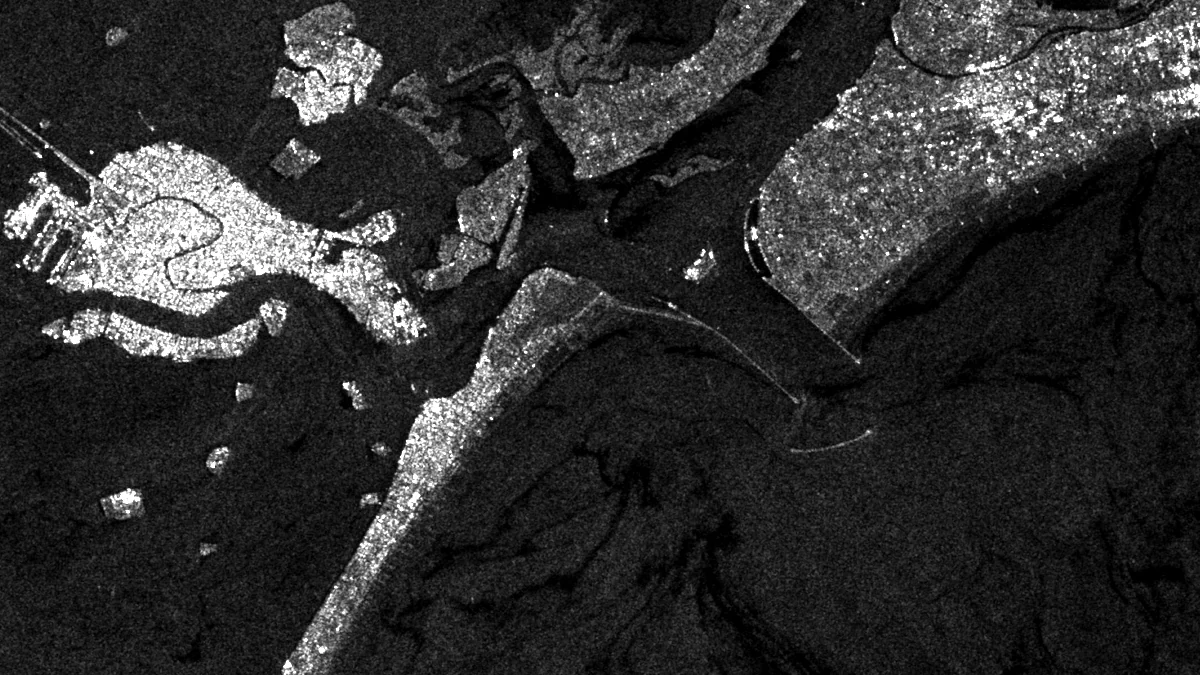
Smooth water appears dark because it reflects little radar energy back toward the sensor, while dense buildings appear bright because their geometry produces strong returns.