

Xarray
Tilebox uses Xarray as its primary data structure for representing and analyzing multi-dimensional satellite data with labeled dimensions and coordinates.
Xarray is a library designed for working with labeled multi-dimensional arrays. Built on top of NumPy and Pandas, Xarray adds labels in the form of dimensions, coordinates, and attributes, enhancing the usability of raw NumPy-like arrays. This enables a more intuitive, concise, and less error-prone development experience. The library also includes a large and expanding collection of functions for advanced analytics and visualization.
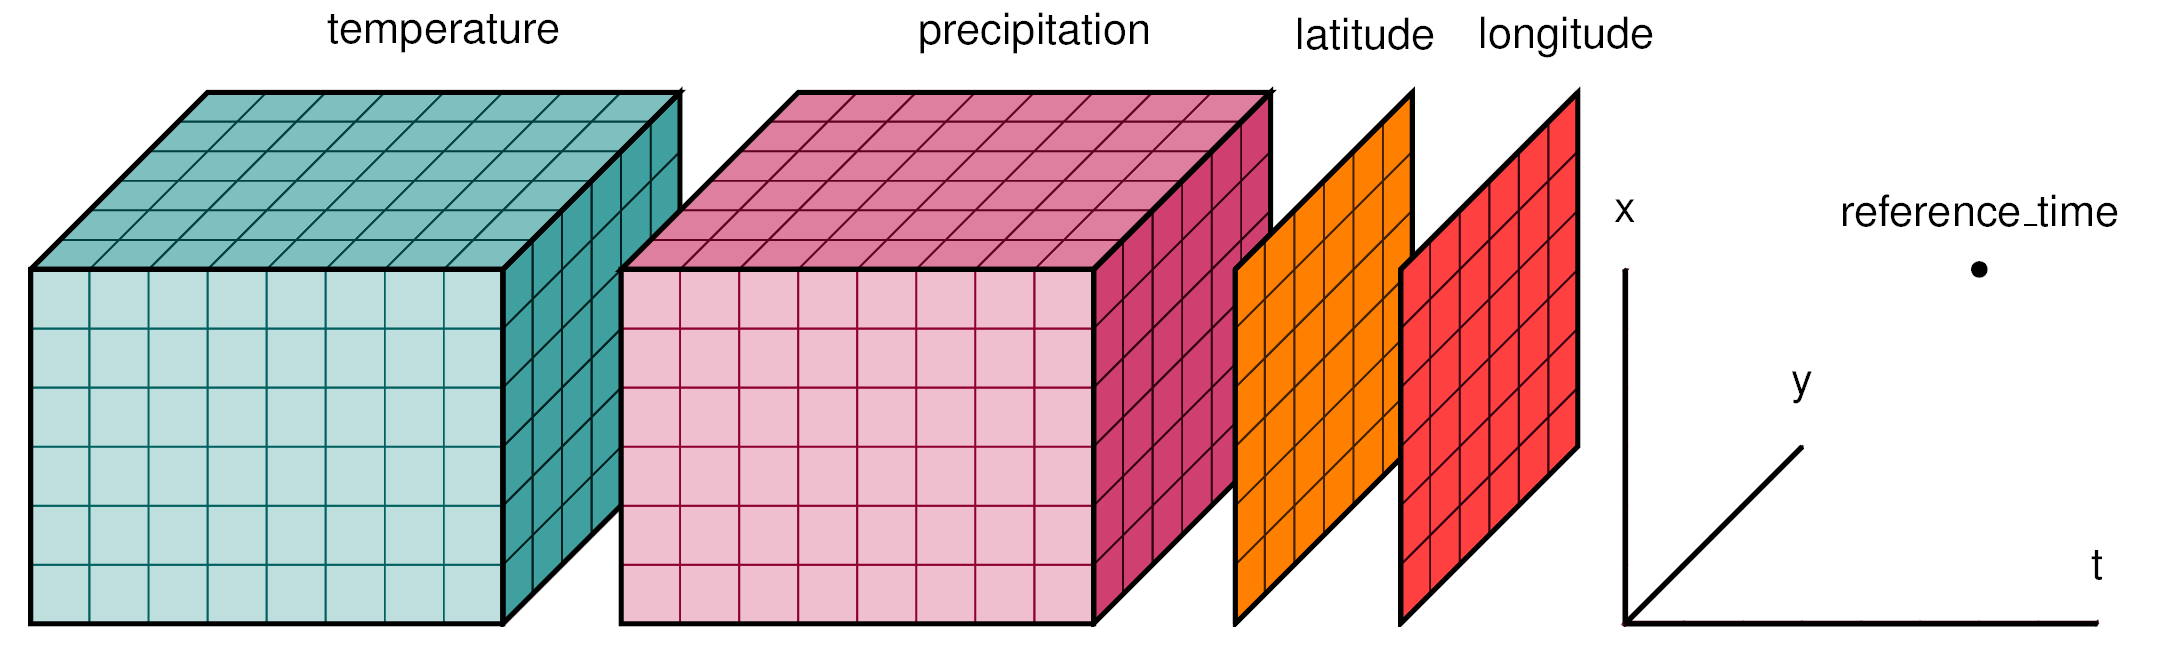
The Tilebox Python client provides access to satellite data as an xarray.Dataset. This approach offers a great number of benefits over custom Tilebox-specific data structures:
Xarray is based on NumPy and Pandas—two of the most widely used Python libraries for scientific computing. Familiarity with these libraries translates well to using Xarray.
Leveraging NumPy, which is built on C and Fortran, Xarray benefits from extensive performance optimizations. This allows Xarray to efficiently handle large datasets.
As a widely used library, Xarray easily integrates with many other libraries. Many third-party libraries are also available to expand Xarray’s capabilities for diverse use cases.
Xarray is versatile and supports a broad range of applications. It’s also easy to extend with custom features.
Example dataset
To understand how Xarray functions, below is a quick a look at a sample dataset as it might be retrieved from a Tilebox datasets client.
from tilebox.datasets import Client

client = Client()
datasets = client.datasets()
collection = datasets.open_data.copernicus.landsat8_oli_tirs.collection("L1GT")
satellite_data = collection.query(temporal_extent=("2022-05-01", "2022-06-01"), show_progress=True)
print(satellite_data)<xarray.Dataset> Size: 305kB
Dimensions: (time: 514, latlon: 2)
Coordinates:
ingestion_time (time) datetime64[ns] 4kB 2024-07-22T09:06:43.5586...
id (time) <U36 74kB '01807eaa-86f8-2a72-1a03-794e7a55...
* time (time) datetime64[ns] 4kB 2022-05-01T08:09:06.5520...
* latlon (latlon) <U9 72B 'latitude' 'longitude'
Data variables: (12/28)
granule_name (time) object 4kB 'LC08_L1GT_175018_20220501_20220...
processing_level (time) <U2 4kB 'L1' 'L1' 'L1' 'L1' ... 'L1' 'L1' 'L1'
satellite (time) object 4kB 'LANDSAT-8' ... 'LANDSAT-8'
product_type (time) object 4kB 'L1GT' 'L1GT' ... 'L1GT' 'L1GT'
copernicus_id (time) <U36 74kB '2181f9f6-1ef0-510c-b715-0f299320...
online (time) bool 514B True True True ... True True True
... ...
resolution (time) int64 4kB 0 0 0 0 0 0 0 0 ... 0 0 0 0 0 0 0 0
bands (time) int64 4kB 12 12 12 12 12 12 ... 12 12 12 12 12
path (time) int64 4kB 175 175 175 175 ... 209 209 209 209
row (time) int64 4kB 18 30 31 32 27 32 ... 18 21 22 23 24
sun_azimuth (time) float64 4kB 164.0 144.9 143.0 ... 153.5 151.6
sun_elevation (time) float64 4kB 44.2 57.78 58.76 ... 56.72 57.82Here’s an overview of the output:
- The
satellite_datadataset contains dimensions, coordinates, and variables. - The
timedimension has 514 elements, indicating that there are 514 data points in the dataset. - The
timedimension coordinate contains datetime values representing when the data was measured. The*indicates a dimension coordinate, which enables label-based indexing and alignment. - The
ingestion_timenon-dimension coordinate holds datetime values for when the data was ingested into Tilebox. Non-dimension coordinates carry coordinate data but are not used for label-based indexing. They can even be multidimensional. - The dataset includes 28 variables.
- The
bandsvariable contains integers indicating how many bands the data contains. - The
sun_elevationvariable contains floating-point values representing the sun’s elevation when the data was measured.
Accessing data in a dataset
By index
You can access data in different ways. The Xarray documentation offers a comprehensive overview of these methods.
To access the sun_elevation variable:
# Print the first sun elevation value
print(satellite_data.sun_elevation[0])<xarray.DataArray 'sun_elevation' ()> Size: 8B
array(44.19904463)
Coordinates:
ingestion_time datetime64[ns] 8B 2024-07-22T09:06:43.558629
id <U36 144B '01807eaa-86f8-2a72-1a03-794e7a556271'
time datetime64[ns] 8B 2022-05-01T08:09:06.552000In the output, the first sun elevation value is 44.19904463. It appears as an xarray.DataArray object to allow access to the corresponding coordinates. To retrieve the plain Python object, use the item() method:
sun_elevation = satellite_data.sun_elevation[0].item()
print(sun_elevation)44.19904463You can access coordinates similarly. For datetime fields, Xarray provides a special dt (datetime) accessor for formatting time as a string:
time_format = "%Y-%m-%d %H:%M:%S"
time = satellite_data.time[0].dt.strftime(time_format).item()
ingestion_time = satellite_data.ingestion_time[0].dt.strftime(time_format).item()
print(f"Measurement 0 was taken at {time} and ingested at {ingestion_time}")Measurement 0 was taken at 2022-05-01 08:09:06 and ingested at 2024-07-22 09:06:43You can also retrieve an entire dataset containing all variables and coordinates for a single data point using the isel method (index selection):
datapoint = satellite_data.isel(time=0)
print(datapoint)<xarray.Dataset> Size: 665B
Dimensions: (latlon: 2)
Coordinates:
ingestion_time datetime64[ns] 8B 2024-07-22T09:06:43.558629
id <U36 144B '01807eaa-86f8-2a72-1a03-794e7a556271'
time datetime64[ns] 8B 2022-05-01T08:09:06.552000
* latlon (latlon) <U9 72B 'latitude' 'longitude'
Data variables: (12/28)
granule_name object 8B 'LC08_L1GT_175018_20220501_20220504_02_T2'
processing_level <U2 8B 'L1'
satellite object 8B 'LANDSAT-8'
... ...Subsets of data
You can access subsets of the data as well. Here are methods to retrieve the first three and last three sun elevations.
# Individual variables
first_3_sun_elevations = satellite_data.sun_elevation[0:3]
print("First 3 sun elevations", first_3_sun_elevations.values)
last_3_sun_elevations = satellite_data.sun_elevation[-3:]
print("Last 3 sun elevations", last_3_sun_elevations.values)

# Whole sub datasets
first_3 = satellite_data.isel(time=slice(0, 3))
last_3 = satellite_data.isel(time=slice(-3, None))
print("Sub dataset of the last 3 data points")
print(last_3)First 3 sun elevations [44.19904463 57.77561083 58.76316786]
Last 3 sun elevations [55.60690523 56.72453179 57.81917624]
Sub dataset of the last 3 data points
<xarray.Dataset> Size: 2kB
Dimensions: (time: 3, latlon: 2)
Coordinates:
ingestion_time (time) datetime64[ns] 24B 2024-07-22T09:08:24.7395...
id (time) <U36 432B '018119eb-5291-edbc-381e-ce71e885...
* time (time) datetime64[ns] 24B 2022-05-31T11:41:01.4570...
* latlon (latlon) <U9 72B 'latitude' 'longitude'
Data variables: (12/28)
granule_name (time) object 24B 'LC08_L1GT_209022_20220531_20220...
processing_level (time) <U2 24B 'L1' 'L1' 'L1'
satellite (time) object 24B 'LANDSAT-8' 'LANDSAT-8' 'LANDSAT-8'
... ...Filtering data
Xarray allows convenient filtering of datasets based on conditions. For example, filter a dataset to only include sun elevation values where cloud cover is 0:
without_cloud = satellite_data.sun_elevation[satellite_data.cloud_cover == 0]
print(without_cloud)<xarray.DataArray 'sun_elevation' (time: 27)> Size: 216B
array([63.89629314, 63.35038654, ..., 64.37400345, 64.37400345])
Coordinates:
ingestion_time (time) datetime64[ns] 216B 2024-07-22T09:06:43.558629 ......
id (time) <U36 4kB '01807f66-8411-2e5d-719b-ce51152175eb' .....
* time (time) datetime64[ns] 216B 2022-05-01T11:34:26.577000 ......You can combine conditions to filter for sun elevation values between 45 and 90 with cloud cover 0:
data_filter = (
    (satellite_data.cloud_cover == 0) &
    (satellite_data.sun_elevation > 45) &
    (satellite_data.sun_elevation < 90)
)
filtered_sun_elevations = satellite_data.sun_elevation[data_filter]
print(filtered_sun_elevations)<xarray.DataArray 'sun_elevation' (time: 27)> Size: 216B
array([63.89629314, 63.35038654, ..., 64.37400345, 64.37400345])
Coordinates:
ingestion_time (time) datetime64[ns] 216B 2024-07-22T09:06:43.558629 ......
id (time) <U36 4kB '01807f66-8411-2e5d-719b-ce51152175eb' .....
* time (time) datetime64[ns] 216B 2022-05-01T11:34:26.577000 ......Selecting data by value
You can use dimension coordinate values to index your dataset. For instance, access the data point recorded at 2022-05-01T11:28:28.249000:
specific_datapoint = satellite_data.sel(time="2022-05-01T11:28:28.249000")
print(specific_datapoint)<xarray.Dataset> Size: 665B
Dimensions: (latlon: 2)
Coordinates:
ingestion_time datetime64[ns] 8B 2024-07-22T09:06:43.558629
id <U36 144B '01807f61-0c59-99ed-8e33-c5d8ed6e7879'
time datetime64[ns] 8B 2022-05-01T11:28:28.249000
* latlon (latlon) <U9 72B 'latitude' 'longitude'
Data variables: (12/28)
granule_name object 8B 'LC08_L1GT_207022_20220501_20220501_02_T2'
processing_level <U2 8B 'L1'
... ...Attempting to access a value not in the dataset raises a KeyError.
nearest_datapoint = satellite_data.sel(time="2022-05-01T11:28:28.000000")
>>> raises KeyError: "2022-05-01T11:28:28.000000"
To return the closest value instead of raising an error, specify a method.
nearest_datapoint = satellite_data.sel(time="2022-05-01T11:28:28.000000", method="nearest")
assert nearest_datapoint.equals(specific_datapoint)  # passes
Dropping duplicates
Xarray allows you to drop duplicate values from a dataset. For example, to drop duplicate timestamps:
deduped = satellite_data.drop_duplicates("time")De-duped datasets are required for certain operations, like selecting data by value.
Statistics
Xarray and NumPy include a wide range of statistical functions that you can apply to a dataset or DataArray. Here are some examples:
cloud_cover = satellite_data.cloud_cover
min_meas = cloud_cover.min().item()
max_meas = cloud_cover.max().item()
mean_meas = cloud_cover.mean().item()
std_meas = cloud_cover.std().item()
print(f"Cloud cover ranges from {min_meas:.2f} to {max_meas:.2f} with a mean of {mean_meas:.2f} and a standard deviation of {std_meas:.2f}")Cloud cover ranges from 0.00 to 100.00 with a mean of 76.48 and a standard deviation of 34.17You can also directly apply many NumPy functions to datasets or DataArrays. For example, to find out how many unique bands the data contains, use np.unique:
import numpy as np
print("Sensors:", np.unique(satellite_data.bands))Sensors: [12]Reading and writing files
Xarray provides a simple method for saving and loading datasets from files. This is useful for sharing your data or storing it for future use. Xarray supports many different file formats, including NetCDF, Zarr, GRIB, and more. For a complete list of supported formats, refer to the official documentation page.
To save the example dataset as a NetCDF file:
satellite_data.to_netcdf("example_satellite_data.nc")This creates a file named example_satellite_data.nc in your current directory. You can then load this file back into memory with:
import xarray as xr

satellite_data = xr.open_dataset("example_satellite_data.nc")
If you would like to follow along with the examples in this section, you can download the example dataset as a NetCDF file here.
Further reading
This section covers only a few common use cases for Xarray. The library offers many more functions and features. For more information, please see the Xarray documentation or explore the Xarray Tutorials.
Some useful capabilities not covered in this section include: